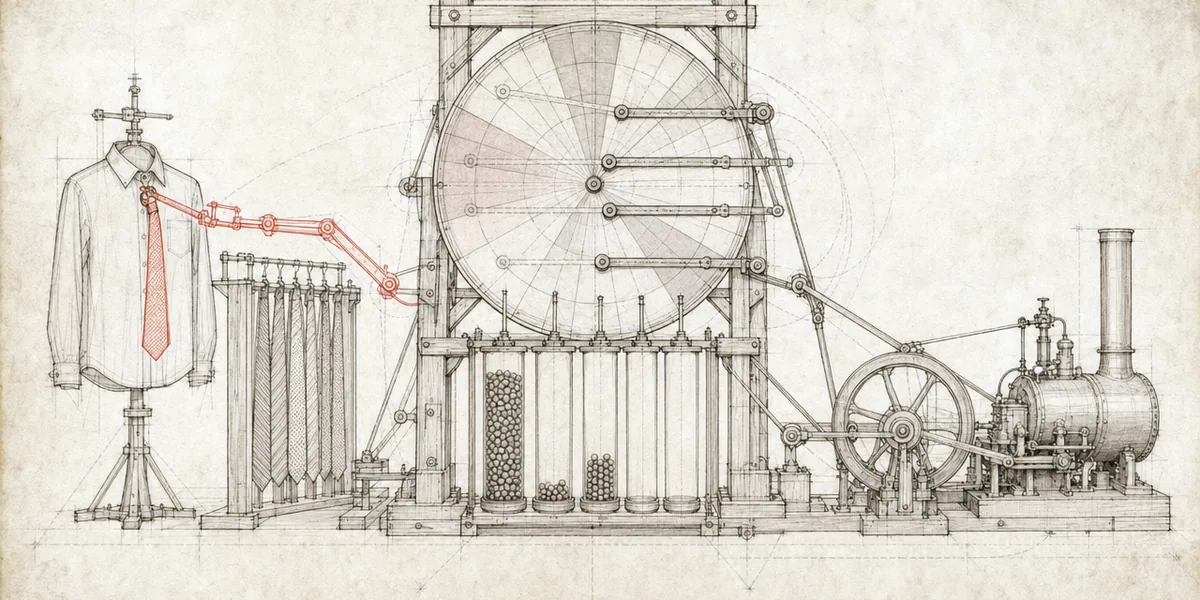
The Tie-O-Matic was a model of how people pick a tie to go with a shirt. It began with color theory, which offers five schemes, and then corrected that theory against what people actually chose.
It was a team project for DePaul's cognitive science course, taught by Peter Hastings Peter HastingsProfessor in the School of Computing at DePaul's Jarvis College of Computing and Digital Media, working on natural language processing, cognitive science, and intelligent tutoring systems. PhD in computer science from Michigan; formerly a lecturer at Edinburgh.Faculty page ↗, with Daniel Watters, Jennifer PianeJPJennifer PianeComputer vision researcher; PhD from DePaul's School of Computing, 2024, on video analysis for activity recognition, after a B.S. and two master's degrees there. Now at Silgan Closures.Google Scholar ↗, and Brandon McWilliams. The team's report is here (PDF, 21 pages).
A web application showed ten shirts and asked people to pick the best tie for each, and to give a reason. By the end of February 2007 it had over four hundred choices. People chose monochrome far more than anything else, rarely chose analogous or complementary, and never chose the other two schemes, so those two came out of the model. People also paired red with grey more often than theory predicts, so the model got a rule for it. And a tie already picked is rated a little lower the next time, because people like variety.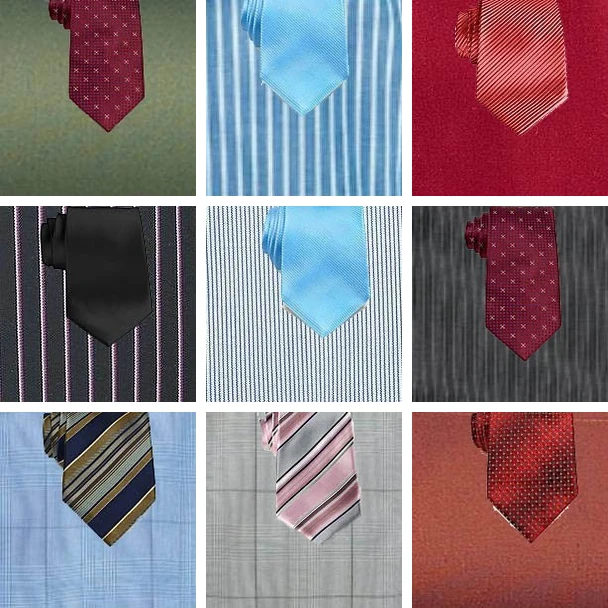
The model gave each shirt one color and had no notion of pattern, so a grey shirt with green in it was simply grey, and nothing stopped a stripe being paired with a plaid. Reading color pixel by pixel would have fixed both; the course ended first.